
22
US consumers account for the largest share of global
polished demand (ie polished diamond content) in
USD terms at approximately 40 per cent, followed by
China/Hong Kong/Macau (approximately 15 per
cent), India (approximately eight per cent), the Gulf
Region
3
(approximately eight per cent) and Japan
(approximately six per cent). Consumers in these top
five markets accounted for approximately 77 per cent
of total demand for polished diamonds in USD terms
in 2013.
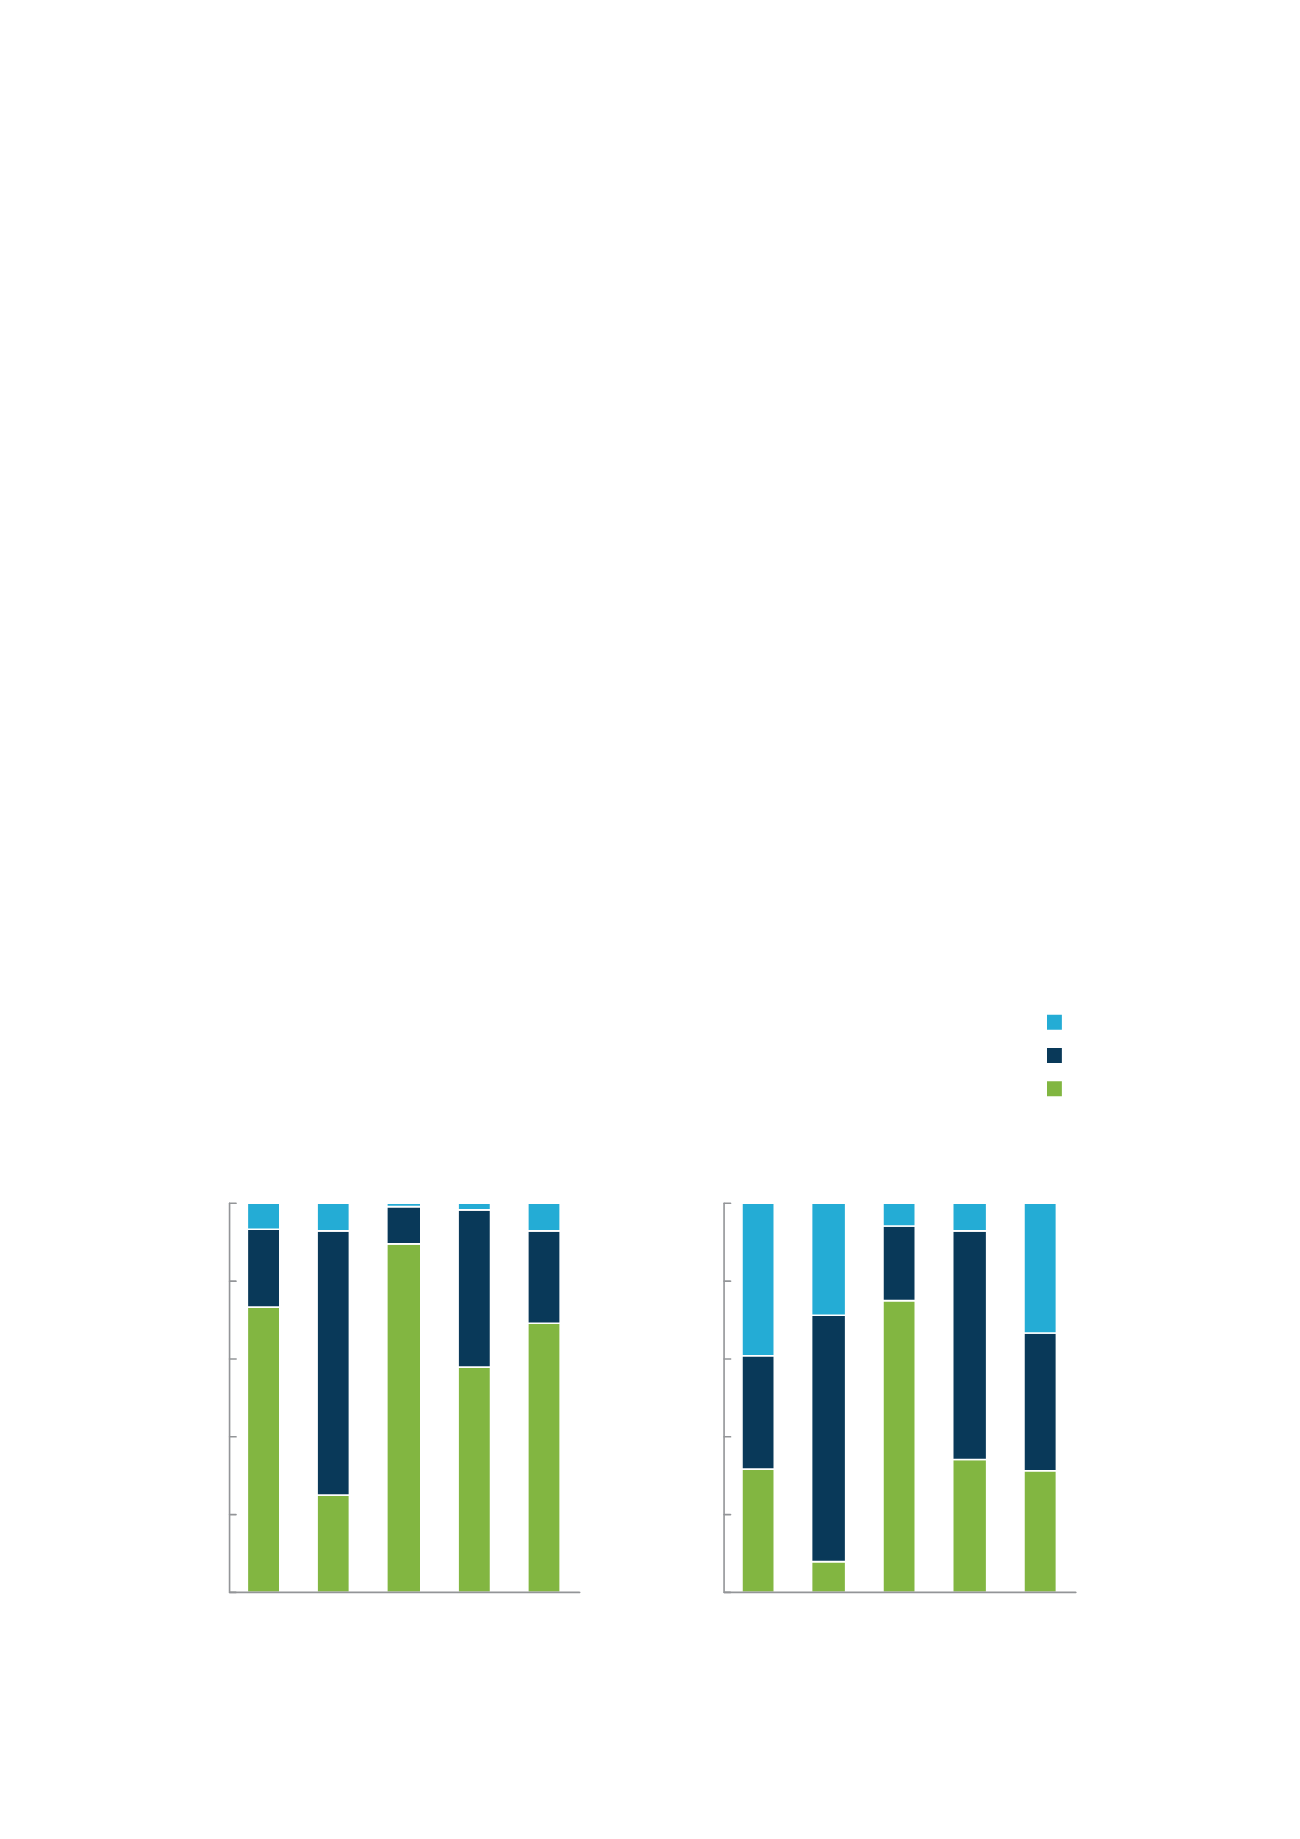
All main geographic markets consume all types of
polished diamonds. However, with the exception of the
US, which has a more evenly distributed consumption
across all types of polished diamonds, other markets
have particular focus areas of polished diamonds
(see Fig. 7). For example, India consumes mainly
stones under 0.08 carats of all clarities, while China
consumes mainly stones between 0.18 carats and 0.99
carats of medium and high clarity. In recent years,
there has been growing demand for larger and higher
clarity diamonds in both the US and China. This will
probably mean increased competition to secure supply
of the best jewels and, potentially, an increasing shift
in value towards those types of diamonds.
Another characteristic of the diamond jewellery
segment is the seasonality of demand. Different
geographic markets have different shopping seasons,
but Q4 tends to be the main sales season globally,
followed by Q1. Fig. 8 illustrates the main periods of
diamond jewellery acquisition by consumers for the
three largest diamond consumer markets. Of note
is the pronounced seasonality of the US in which a
high proportion of pieces are acquired by consumers
between Thanksgiving and Christmas. Other markets
have slightly less pronounced seasonal patterns.
LOOKING AHEAD
A detailed view of future consumer trends for the
diamond industry’s most important markets, the US
and China, is provided in the ‘In Focus’ section of this
report: see ‘Changing consumer preferences and the
growth of brands in the United States and China’.
Source: De Beers
F I G . 7 :
TYPE OF POL I SHED D I AMOND SOLD I N MA I N D I AMOND JEWELLERY
MARKETS , BY S I ZE BAND
Note:
Large = 1+ carat, Medium = 0.18-0.99 carat, Small = <0.18 carat
MARKET SPLIT BY VOLUME,
Carats
2013 polished diamonds in jewellery sales, per cent
100
80
60
40
20
0
Gulf
Japan
India
China
US
MARKET SPLIT BY VALUE,
USD
100
80
60
40
20
0
Gulf
Japan
India
China
US
Small
Medium
Large


