
43
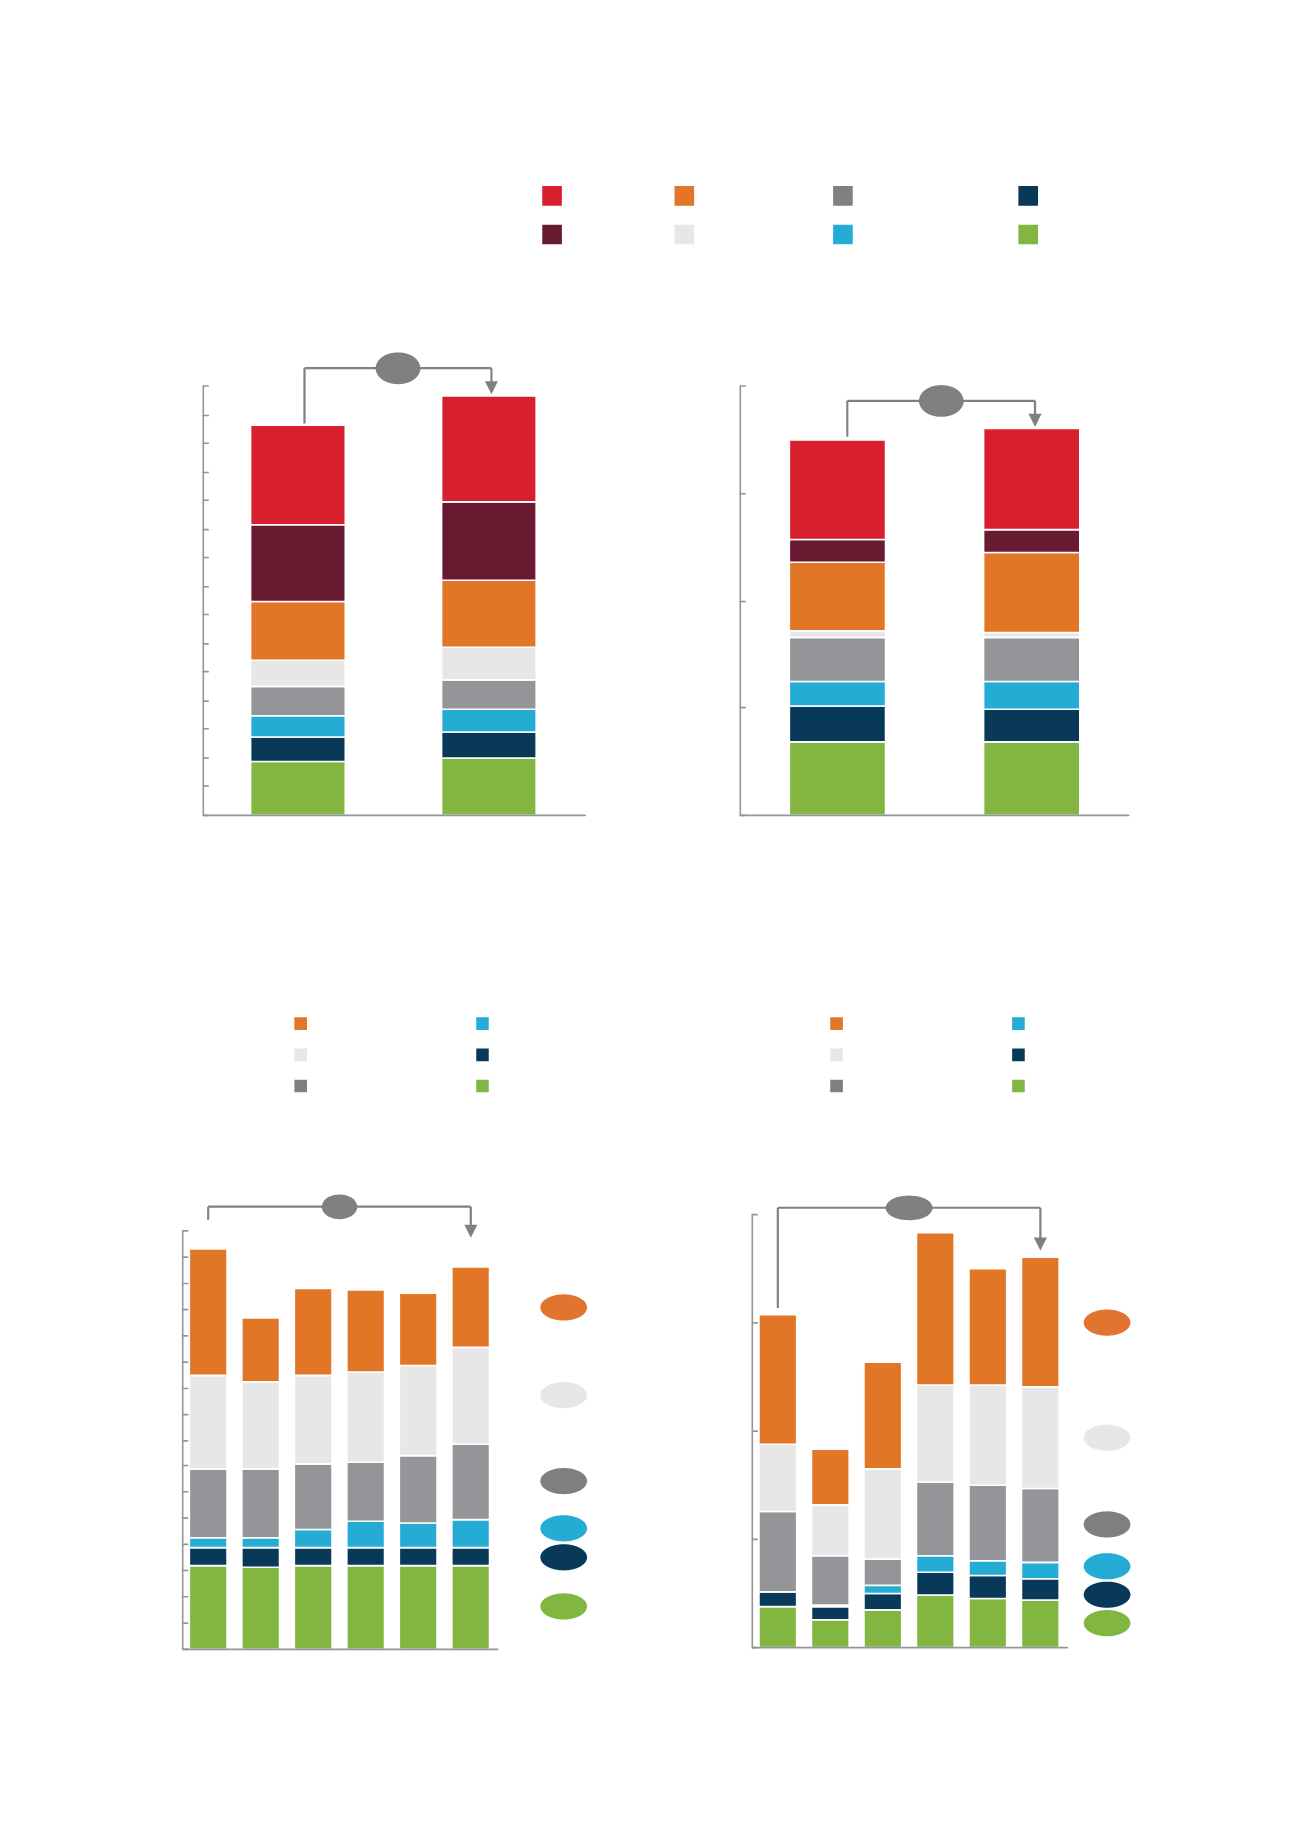
FIG. 25:
GLOBAL ROUGH DIAMOND PRODUCTION
VOLUME
Source: De Beers estimates, Kimberley Process Statistics
10
140
120
80
40
60
100
20
0
30
50
70
90
110
130
150
160 153
-4
2013
146
2012
2011
2010
2009
2008
-8
1
2
22
0
1
Informal/Artisanal
Other Major/Junior
ALROSA
Catoca
Zimbabwe (Chiadzwa)
De Beers
2008-2013 CAGR
Per cent
2008-2013 CAGR
Per cent
Million carats
FIG. 26:
GLOBAL ROUGH DIAMOND PRODUCTION
VALUE
Source: De Beers estimates
0
8
71
3
10
5,000
0
20,000
15,000
10,000
+17
2008
2011
2010
2013
2012
2009
Catoca
Other Major/Junior
ALROSA
De Beers
Informal/Artisanal
Zimbabwe (Chiadzwa)
1
2008-2013 CAGR
Per cent
2008-2013 CAGR
Per cent
USD million
Source: De Beers estimates
F I G . 2 4 :
ROUGH D I AMOND PRODUCT I ON BY MA I N PRODUC I NG COUNTRY
VOLUME
Million carats
0
10
20
30
40
50
60
70
80
90
100
110
120
130
140
150
+7
2013
2012
All others
Botswana
DRC
Angola
South Africa
Canada
Australia
Russia
VALUE
USD million
0
5,000
10,000
15,000
20,000
+3
2013
2012
GROWTH
Per cent
GROWTH
Per cent


