
47
2
2
4
5
7
10 13
7
11 16 21
Source: SNL Metals & Mining's Corporate Exploration Strategies 2013; includes grassroots, late stage, and mine site exploration expenditures
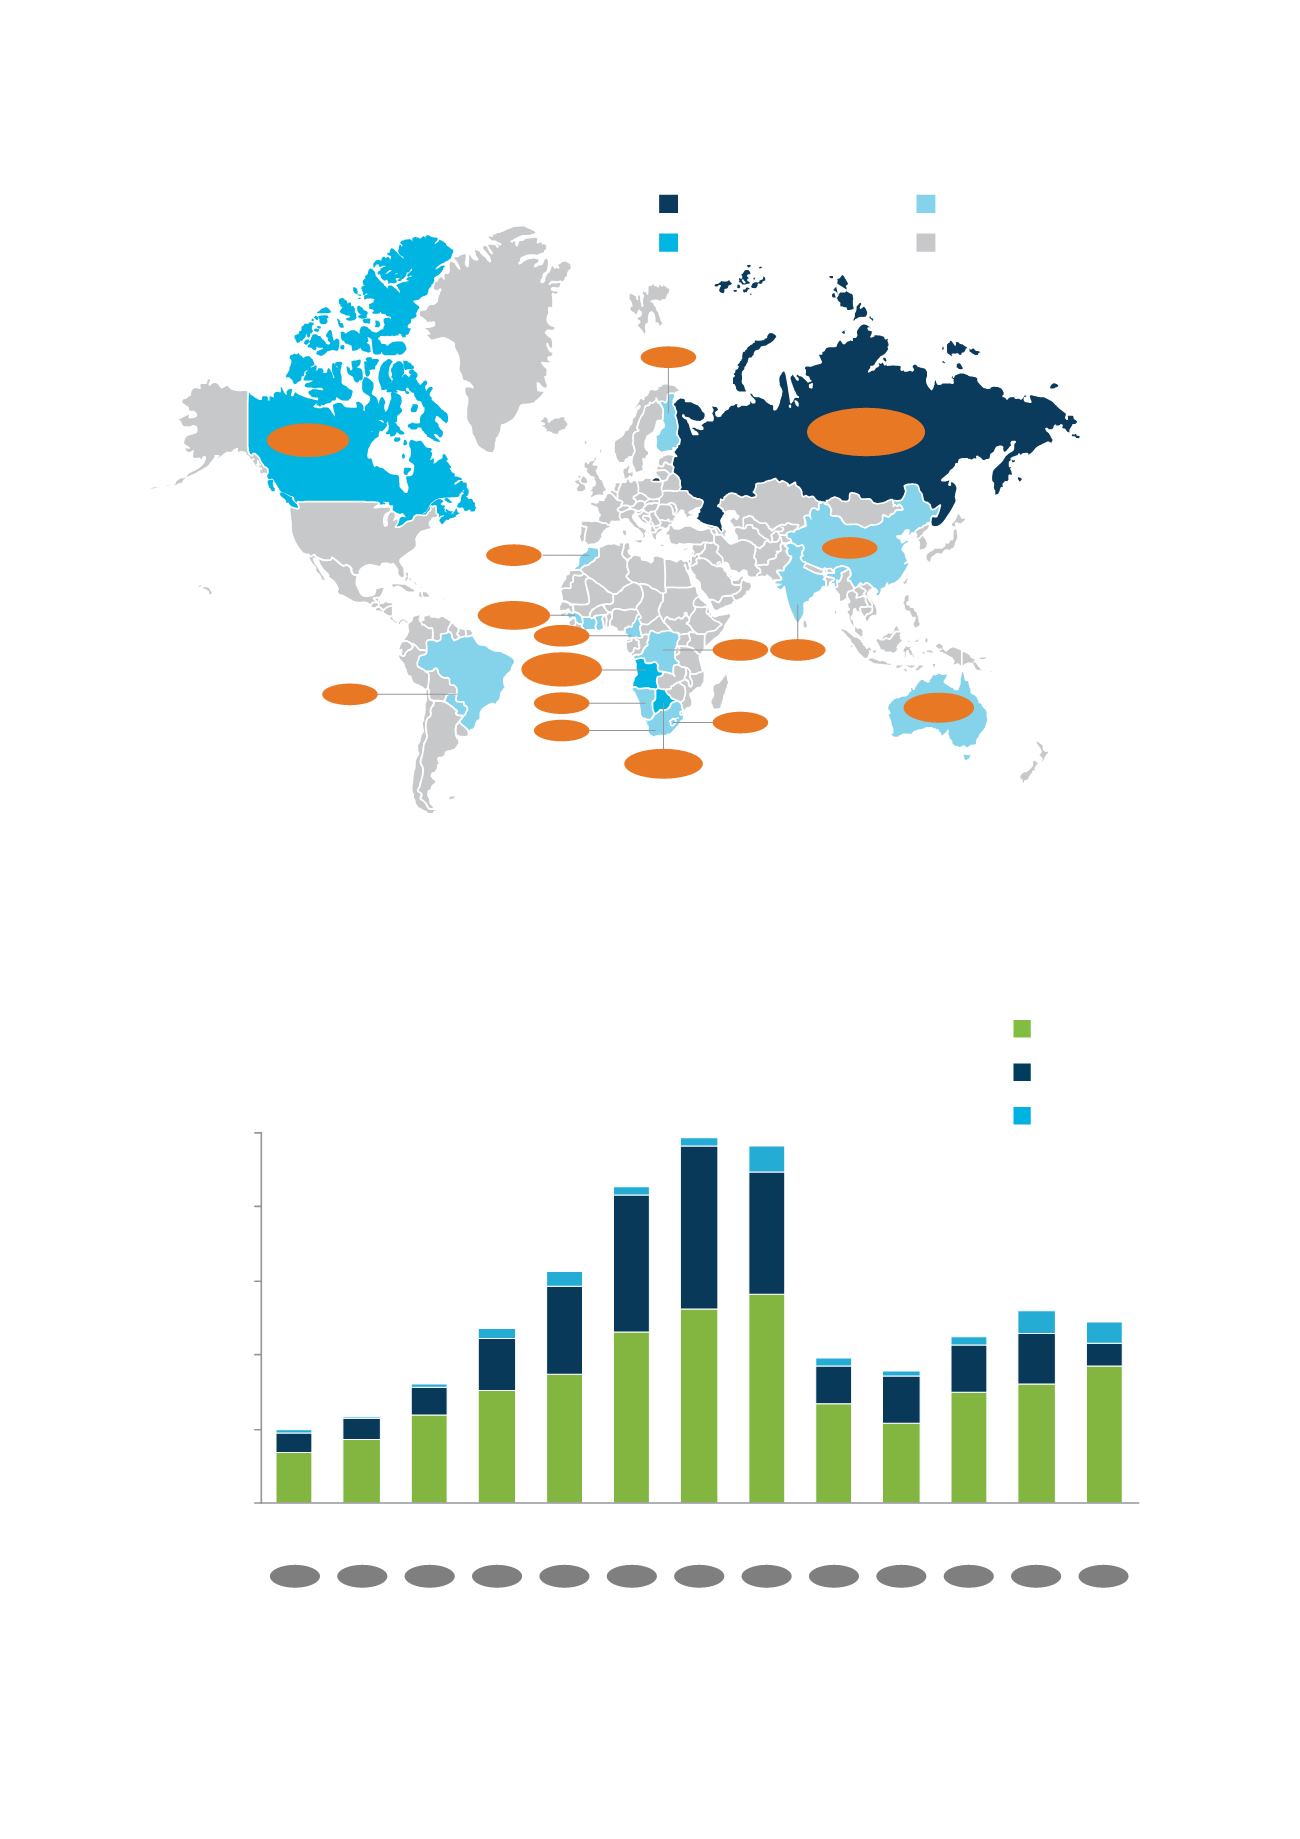
F I G . 3 0 :
GLOBAL D I AMOND EXPLORAT I ON BUDGETS , 200 1 - 20 1 3 BY
COMPANY TYPE
0
200
400
600
800
1,000
2012 2013
2011
2010
2009
2008
2007
2006
2005
2004
2003
2002
2001
ALL MINING EXPL.
EXPENDITURE
USD billion
2
USD million (nominal)
i
A company with adjusted annual nonferrous mining-related revenue of US$500m or more
ii
A company whose principal means of financing exploration is through equity financing
iii
Entities not included in the above categories
Other
iii
Majors
i
Juniors
ii
14
14
54
4
1
7
0
0
1
ii
2
i
0
1
0
1
13
1
0
iii
F I G . 2 9 :
SHARE OF GLOBAL D I AMOND EXPLORAT I ON SPEND BY COUNTRY
20 1 3 - 20 1 4
More than 50% share
5–49% share
0.1–4.9% share
None
Per cent
i
Guinea: 0.5%; Sierra Leone: 4%;
Liberia: 0.5%
ii
Lesotho: 0.9%
iii
Paraguay and Brazil: 0.1%
Note:
Total may not sum due to rounding
Source: De Beers estimates based on company publications and websites, SNL Metals & Mining’s Corporate
Exploration Strategies 2013; includes grassroots, late stage, and mine site exploration expenditures


